Application on MOCA 100k
Alexis Vandenbon & Diego Diez
2022-11-09
a05_moca_100k.RmdLoad data
Here we apply haystack to 100k cells from the Mouse
Organogenesis Cell Atlas (MOCA). The sparse matrix data was downloaded
from the MOCA
website. The data was converted into a Seurat object and processed
following the standard
pipeline.
## An object of class Seurat
## 16811 features across 100000 samples within 1 assay
## Active assay: RNA (16811 features, 2000 variable features)
##  2 dimensional reductions calculated: pca, umap
Haystack
We run haystack using PCA coordinates with 50 PCs.
system.time({
  res <- haystack(x, coord="pca")
})
## user system elapsed
## 256.045 28.569 284.612It takes around 5 minutes to complete in a standard personal
computer. Here we show the top 10 genes selected by
haystack.
top <- show_result_haystack(res)
head(top, n=10)
## D_KL log.p.vals log.p.adj
## Ppp1r1c 0.25684566 -202.6767 -198.4511
## Acp5 0.13324559 -173.9745 -169.7489
## Itih2 0.19905815 -168.2541 -164.0285
## A1cf 0.27878610 -161.4285 -157.2029
## Kel 0.08720005 -158.6047 -154.3791
## Rhag 0.08512571 -157.6347 -153.4091
## Ermap 0.08432139 -157.2455 -153.0199
## Pkhd1l1 0.09157942 -156.9557 -152.7301
## Spta1 0.08178285 -155.5603 -151.3347
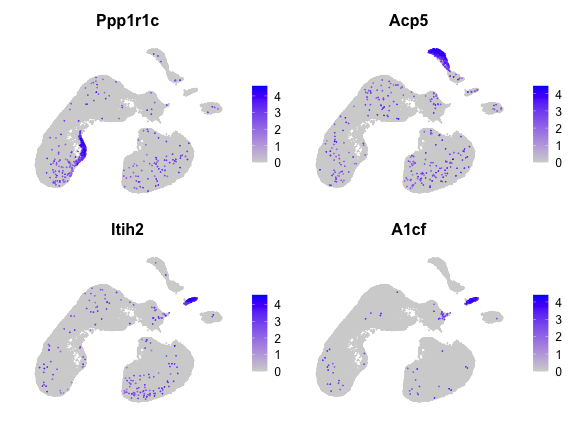
## Gm43449 0.16349201 -155.3943 -151.1687And here we plot the expression of the top 4 genes.
FeaturePlot(x, head(rownames(top), 4), order=TRUE) & NoAxes()